 OILTRADING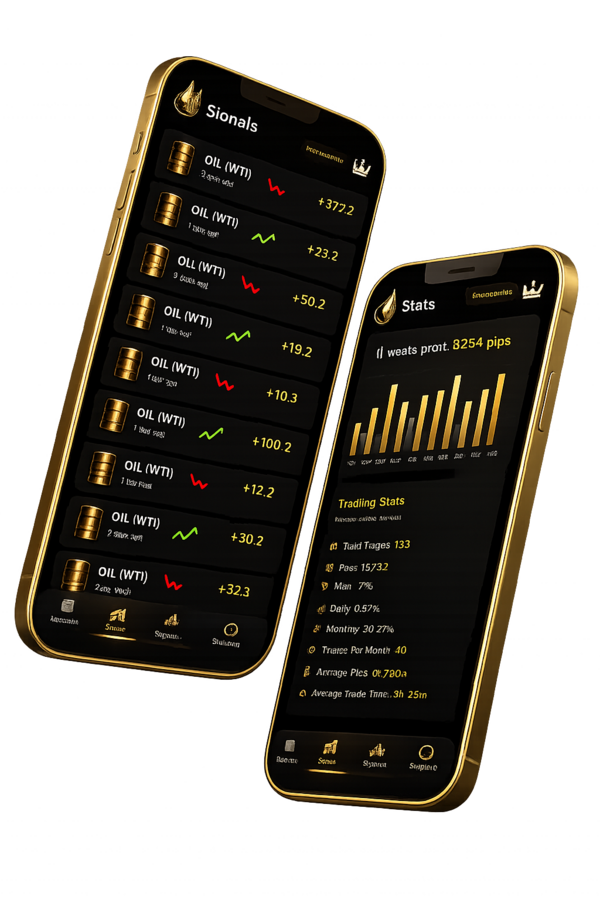
What is USOIL trading?
Oil trading explained
USOIL represents WTI crude oil quoted in US dollars per barrel. It trades nearly 24 hours a day, 5 days a week through futures and CFD brokers. Unlike stocks, you can trade oil in both directions: buy (long) when you expect prices to rise, or sell (short) when you expect them to fall.
Why trade oil?
- Highest daily volume of any commodity
- Large price swings = high profit potential
- Inversely correlated to USD - clear fundamental drivers
- Transparent catalysts: EIA inventories, OPEC+, demand data
- Available on every major broker with tight spreads
- Can be traded with leverage for capital efficiency
What moves the oil price?
Understanding these drivers is essential for anticipating oil price direction.
US Dollar (DXY)
Oil is inversely correlated to the dollar. When USD weakens, oil typically rises. Watch DXY for directional bias.
Interest Rates
Higher US real yields = lower oil. When the Fed cuts rates or signals dovishness, oil rallies.
Geopolitics
Wars, sanctions, and shipping disruptions can threaten crude supply and push prices higher.
OPEC+ Policy
Production cuts, quota compliance, and spare capacity decisions create structural support or pressure.
Inventories
EIA stock draws are bullish because they show demand exceeding available supply.
Growth Data
Weak economic data can pressure oil because crude demand depends on transport and industrial activity.
Watch oil trading in action.
See professional USOIL signal execution on OilTrading.
Oil trading strategies.
Trend Following
Identify the higher-timeframe direction and trade with it. Use moving averages (50/200 EMA) for confirmation.
Breakout Trading
Wait for price to break key support/resistance with momentum. Enter on the break, SL below the level.
Range Trading
During consolidation, buy at support and sell at resistance. Works well in quiet Asian sessions.
News Trading
React to NFP, CPI, FOMC. Oil can move 200+ cents in minutes. Requires fast execution and wider stops.
Signal-Based Trading
Let OilTrading analysts do the analysis. Receive entry/SL/TP, copy into your broker. Best for busy traders.
Scalping
Quick 5-30 cent trades on M1-M5 charts during London/NY overlap. High frequency, tight risk.
Protect your capital.
Risk management is more important than any strategy. Follow these rules religiously.
Never risk more than 1-2% per trade
If your account is $10,000, risk max $100-$200 per trade. This keeps you in the game through inevitable losing streaks.
Always use a hard stop-loss
No exceptions. Mental stops don't work. Set the SL in your broker before the trade is live. OilTrading provides one on every signal.
Position size from risk, not greed
Calculate your lot size from your stop distance and risk amount. Never pick a lot size first - let the math decide.
Cut losers fast, let winners run
Move SL to breakeven after TP1 hits. Take partials at TP2. Let the rest ride to TP3. Never add to losing positions.
Live USOIL levels + signals.
Get auto-calculated support/resistance based on daily pivot points, plus live signals that fire when price approaches these levels. No more watching charts all day.
- → Daily pivot-based S1/S2/R1/R2
- → Signals fire at key levels automatically
- → Session-aware (London/NY overlap prioritised)
- → Lot size pre-calculated for 1% risk
Oil trading questions, answered.
What does a USOIL price represent? +
USOIL commonly labels a broker product linked to WTI crude oil, quoted in US dollars per barrel. It is not the same contract as every CL or MCL future, and WTI is distinct from Brent. Quote source and contract expiry explain some price differences.
How accurate are OilTrading USOIL signals? +
OilTrading maintains a 93% win rate calculated across all closed USOIL trades since 2018. This is verified publicly - every signal (wins and losses) is timestamped and logged in the app. The average winning trade captures 50–80 cents, with an average trade duration of 4 hours 15 minutes. We publish 3–6 high-conviction signals per trading day.
What does an oil trading signal include? +
Every OilTrading signal includes: exact entry price in cents (e.g. 72.50), stop-loss level, three take-profit targets (TP1, TP2, TP3), suggested lot size based on 1% risk, and the trade direction (BUY or SELL). 1 cent movement = $10 on a standard lot (1,000 barrels). After entry, we send live management updates - SL adjustments, partial close instructions, and "move to breakeven" alerts.
What moves the oil price? +
Oil prices respond to supply, consumption, inventories, producer decisions, refinery demand, geopolitics and the dollar. The EIA Weekly Petroleum Status Report adds US inventory and supply-demand context; the price response also depends on what the market expected.
How much capital do I need to trade oil? +
The amount of capital needed depends on the product, minimum position size, margin requirement and chosen stop distance. Calculate cash exposure from the actual contract specification and account currency. There is no universal starting balance that suits every broker or trading plan.
Which broker should I use for oil trading? +
OilTrading signals work with any broker offering USOIL (WTI Crude). Popular choices: IC Markets (raw spread 2–3 cents, best for scalpers), Exness (competitive oil spreads, instant withdrawals), and Pepperstone (FCA regulated, TradingView integration). Key factors: spread (lower is better - aim for under 3 cents on USOIL), execution speed, regulation, and platform support (MT4/MT5/cTrader).
What is the best time to trade oil? +
Oil is most active during the US session open (9:30 AM ET), when NYMEX pit trading begins and institutional flow drives 150+ cent moves. The EIA inventory release (Wed 10:30 AM ET) is the single biggest weekly mover - crude inventory data can move oil $1–$3 per barrel in minutes. The London session (3:00 AM ET) provides good liquidity for Brent/WTI spread analysis with steady 50–100 cent ranges.
Is oil trading risky? +
Oil prices can move sharply around supply news, inventories and contract expiry. Position risk depends on barrels represented, stop distance and execution costs; a CFD lot is not automatically the same exposure as a CL or MCL contract.
Start trading oil today.
Download OilTrading free. Professional signals, no experience needed.