Oil price education

What moves the
oil price.

Oil is driven by real-world supply and demand — not just charts. Understanding the five key forces behind every USOIL move puts you ahead of traders who rely on technicals alone.

5
Key drivers
$100B+
Daily volume
100–300
Daily range (cents)
93%
Our signal accuracy
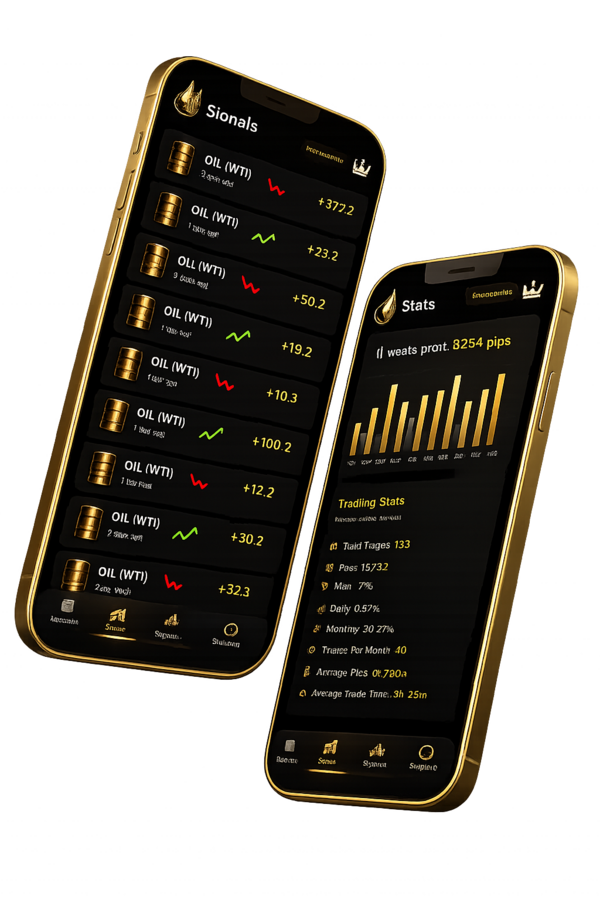
OilTrading app preview

USOIL (WTI Crude) prices are driven by five interconnected forces: supply-side factors (OPEC+ quotas, US shale output, EIA inventory data), demand-side factors (global GDP growth, China imports, seasonal patterns), the US dollar, geopolitical risk, and market positioning. The EIA Weekly Petroleum Status Report — released every Wednesday at 10:30 AM ET — is the single biggest weekly price mover. OilSniper's automated signals monitor all five forces 24/5, firing alerts when the combination creates high-probability entry opportunities.

Supply

What controls the supply of oil.

01
Highest impact

OPEC+ Production Quotas

OPEC+ (Saudi Arabia, Russia, and 21 other nations) controls ~40% of global oil production. When the cartel announces production cuts, oil rallies $2–$8/barrel within days. Quota increases or compliance breakdowns send oil lower. Saudi Arabia holds the most spare capacity and acts as the swing producer. Watch for OPEC+ meetings (quarterly) and the JMMC (monthly monitoring committee).

02
Structural (medium-term)

US Shale & Rig Counts

The US produces 13+ million barrels per day — the world's largest producer. Shale (Permian Basin, Eagle Ford, Bakken) responds faster to price signals than any other source. The Baker Hughes Rig Count, released every Friday at 1:00 PM ET, is the leading indicator: rising rigs signal future production growth (bearish), falling rigs signal contraction (bullish). US shale is the market's most important swing producer outside OPEC+.

03
Highest weekly impact

EIA Weekly Inventory Data

The EIA Weekly Petroleum Status Report (Wednesday 10:30 AM ET) reports crude inventories, gasoline stocks, distillate stocks, refinery utilization, production, and imports/exports. A larger-than-expected crude draw is bullish; a build is bearish. The API report (Tuesday 4:30 PM ET) provides a preview and often causes pre-positioning. Cushing, Oklahoma inventory levels are critical — when Cushing stocks approach minimum operating levels, backwardation intensifies.

04
Episodic — high

Strategic Petroleum Reserve (SPR)

The US Strategic Petroleum Reserve holds up to ~700 million barrels in Gulf Coast salt caverns. When the government announces SPR releases (as in 2022, releasing 180 million barrels), it adds immediate supply and can cap prices for months. SPR purchases to refill reserves remove barrels from the market. SPR announcements are made by the White House or Department of Energy and can move oil $1–$3 on the day.

05
High — episodic

Geopolitical Supply Disruptions

Oil supply is geographically concentrated in politically volatile regions. The Strait of Hormuz (between Iran and Oman) sees ~20% of all global oil transit — any threat to passage sends oil spiking. Russia sanctions, Libya civil conflict, Venezuela production collapse, Nigeria pipeline attacks, and Middle East tensions all create supply outages. Geopolitical risk is the hardest factor to predict but often produces the fastest moves ($3–$8 in hours).

06
Medium — regional

Refinery & Infrastructure

Refinery capacity and utilization rates determine how much crude can be turned into usable products. US refinery utilization sits at ~90-95%. Hurricanes in the Gulf of Mexico (where ~50% of US refining capacity is located) can shut refineries for weeks, causing crude builds (bearish for oil) but gasoline spikes. The crack spread — the difference between crude and refined product prices — is a key indicator of refinery margin health.

Demand

What controls the demand for oil.

07
Structural — highest impact

Global GDP Growth

Oil is THE economic growth commodity. Every percentage point of global GDP growth adds hundreds of thousands of barrels per day to demand. When economies expand, factories run, trucks deliver, planes fly — all burning oil. Recessions destroy demand (2020 COVID saw oil go negative). Watch: IMF World Economic Outlook, World Bank forecasts, and PMI (Purchasing Managers Index) data from major economies.

08
Very high — structural

China Demand

China is the world's largest oil importer at ~11 million barrels per day. Chinese PMI data, industrial production, and crude import figures directly move oil prices. When China's economy slows (as in 2022-2023 lockdowns), oil falls. Chinese teapot refinery utilization and crude import quotas are closely watched by professional traders. The monthly Chinese crude import data (released ~10th of each month) is a key demand signal.

09
Medium — predictable

Seasonal Demand Patterns

Oil demand follows strong seasonal rhythms. Summer driving season (May through September) increases gasoline demand by ~1 million barrels/day. Winter heating oil season (November through February) boosts distillate demand in the Northern Hemisphere. Refinery maintenance season (March-April and September-October) temporarily reduces crude demand. Professional traders position weeks ahead of these predictable shifts.

10
Very high — real-time

US Dollar Strength (DXY)

Oil is priced globally in US dollars. A stronger dollar makes oil more expensive for buyers in euros, yen, yuan, and other currencies — reducing international purchasing power and demand. The DXY-USOIL inverse correlation is approximately -0.4 to -0.6. This relationship acts in real time: intraday dollar strength almost always translates to oil weakness. The effect is most pronounced during Fed policy shifts and US data surprises.

11
Medium — growing

Transportation & Jet Fuel

Transportation accounts for ~60% of global oil consumption. Road freight, passenger vehicles, aviation, and shipping all depend on petroleum products. Air travel demand (measured by IATA passenger-kilometers) directly drives jet fuel consumption. Post-pandemic air travel recovery has been a major demand driver. Shipping fuel demand shifts with global trade volumes and IMO regulations on marine fuels.

12
Long-term — bearish

Energy Transition & EV Adoption

The long-term demand picture is shaped by electric vehicle adoption and renewable energy growth. EVs now account for ~18% of global new car sales. Every 1% increase in EV market share displaces roughly 100,000 barrels/day of gasoline demand by 2030. However, total oil demand is still growing (~1 million b/d annually) because rising developing-world consumption outpaces developed-world efficiency gains for now. The IEA's medium-term outlook is the key reference.

The combined picture

When supply and demand align or conflict.

Understanding each driver individually is only half the analysis. The most powerful — and tradable — oil moves happen when supply and demand forces align in the same direction, or when they conflict and create uncertainty.

Strongly bullish combination:

OPEC+ production cuts + falling US rig count + EIA crude draws + strong China imports + weakening USD + summer driving demand. When 4 or more of these align, oil typically makes a sustained multi-week move higher. Early 2022 (post-invasion supply fears) and mid-2023 (OPEC+ cuts + summer demand) are classic examples.

Strongly bearish combination:

OPEC+ quota increases + rising US production + EIA inventory builds + weakening China PMI + strengthening USD + recession fears. The 2020 COVID crash (WTI went negative) is the extreme example, but more typical is the late 2014-2015 collapse when OPEC+ flood and US shale boom combined with slowing China demand, taking oil from $100 to $26.

The conflict zone (hardest to trade):

OPEC+ cutting supply (bullish) + weakening China demand (bearish) + geopolitical risk premium (bullish) + strong USD (bearish). When forces conflict, oil oscillates in a range and produces false breakouts. This is when reducing position size and waiting for a clear catalyst — which OilSniper signals do automatically — produces better results than forcing a directional trade.

Key reports

Reports that move oil every week.

Report
Release
Avg move
What it tells you
EIA Petroleum Status
Wed 10:30 AM ET
$1.00–$3.00
Crude inventories, production, refinery runs, imports/exports. A surprise crude draw or build is the single biggest weekly oil mover.
API Crude Oil Stock
Tue 4:30 PM ET
$0.50–$1.50
Industry preview of EIA data. Often causes pre-positioning. A large API miss creates a tradeable gap into Wednesday's EIA release.
Baker Hughes Rig Count
Fri 1:00 PM ET
$0.30–$1.00
Active oil drilling rigs in the US and Canada. Rising count → future supply increase (bearish). Falling count → future contraction (bullish). Coincides with COT data.
IEA Oil Market Report
Monthly (mid-month)
$1.00–$2.00
Global supply/demand balance, demand growth forecasts, OECD inventory levels. The IEA's demand revision is often the single line item that moves markets.
OPEC+ Monthly Report
Monthly (mid-month)
$0.50–$1.50
OPEC's own demand and supply forecasts. Production figures by country — reveals quota compliance. Market focuses on Saudi output data.
CFTC COT Report
Fri 3:30 PM ET
Slow, positioning
Commitments of Traders: shows speculative long/short positioning in oil futures. Extreme long = contrarian sell warning. Extreme short = squeeze potential.
EIA STEO
Monthly (early month)
$0.50–$1.00
Short-Term Energy Outlook: US production forecasts, price projections, inventory outlook. Forward guidance on domestic supply trajectory.
Chinese Crude Imports
Monthly (~10th)
$0.50–$1.50
World's largest importer's crude purchases. Falling imports signal weak demand and economic slowdown (bearish). Rising imports confirm strong demand (bullish).
Market sessions

When oil is most active.

Oil trades 23 hours a day, 5 days a week (CME/NYMEX futures trade Sun 6 PM – Fri 5 PM ET with a 1-hour daily settlement break). But not all hours are equal. Volume and volatility concentrate around key report releases and session overlaps.

US Open
9:30 AM–10:30 AM ET
★★★★★

Highest volatility window. US institutions enter the market. On Wednesdays, this leads directly into the EIA release at 10:30 AM — the #1 weekly mover.

EIA Release Window
Wed 10:30 AM ET
★★★★★

The single most important 30-minute window every week. Crude inventory data moves oil $1-3 within minutes. Expect widened spreads and rapid price discovery.

London Open
3:00 AM–5:00 AM ET
★★★★☆

European trading begins. Physical crude traders enter. Often sets the day's direction before US markets open. Brent moves lead WTI during this window.

London–NY Overlap
8:00 AM–12:00 PM ET
★★★★★

Most liquid period. Spreads at their tightest. Where the majority of daily volume clears. Market absorbs overnight news and positions for US data.

API Release
Tue 4:30 PM ET
★★★★☆

Industry inventory preview. Large surprise can move oil $1+. Traders position for Wednesday's official EIA data based on API direction and magnitude.

Asian Session
7:00 PM–3:00 AM ET
★★☆☆☆

Lower volume. Physical demand from China and India. Prone to slow trends. Asian data releases (Chinese PMI, crude imports) can trigger moves during this window.

App demo

Live oil analysis.

See how our analysts read supply, demand, and inventory data in real time before firing a signal.

Download the App →

Oil price movement FAQ

What is the single biggest weekly mover of the oil price? +

The EIA Weekly Petroleum Status Report, released every Wednesday at 10:30 AM ET. It reports US crude oil inventories, production, refinery utilization, and import/export data. A surprise crude oil inventory draw is bullish; a surprise build is bearish. Moves of $1–$3 per barrel within minutes of the release are typical. The API report (Tuesday 4:30 PM ET) provides a preview and often causes pre-positioning.

How do OPEC+ decisions affect oil prices? +

OPEC+ controls ~40% of global oil production. When the cartel announces production cuts (as they did repeatedly in 2023-2024), oil typically rallies $2–$8 per barrel. Saudi Arabia holds the most spare capacity and acts as the swing producer. The market watches OPEC+ quarterly meetings, monthly JMMC recommendations, and individual country compliance data. A surprise production increase or cheating by members is bearish.

Why does the US dollar affect oil? +

Oil is priced globally in US dollars. When the DXY strengthens, oil becomes more expensive for buyers with euros, yen, or yuan — reducing demand and pushing prices lower. The inverse correlation is approximately -0.4 to -0.6. This acts in real time: intraday dollar strength almost always translates to intraday oil weakness unless there is a simultaneous supply disruption.

What role does US shale production play? +

The US is the world's largest oil producer at 13+ million barrels per day — mostly from shale (Permian Basin). US shale responds quickly to price signals: when oil is above $70, drilling accelerates. The Baker Hughes Rig Count (Fridays) is the leading indicator. US shale is the most important non-OPEC swing factor — rising production can offset OPEC+ cuts, capping price rallies.

When are oil prices most volatile? +

Oil is most volatile during: (1) EIA release — Wednesdays 10:30 AM ET (the #1 weekly mover), (2) OPEC+ meeting announcements (quarterly, $2-$8 moves), (3) geopolitical events — Strait of Hormuz tensions, Russia/Ukraine, Middle East conflict ($3-$8 in hours), (4) US dollar and Fed policy surprises, (5) Chinese economic data releases. Weekend gap risk is significant — never hold large unhedged positions through Sunday open.

What is the difference between WTI and Brent crude? +

WTI (West Texas Intermediate) is the US benchmark, delivered at Cushing, Oklahoma, and traded on CME/NYMEX. Brent is the international benchmark from the North Sea, traded on ICE. WTI is lighter and sweeter (lower sulfur) than Brent. For retail traders, USOIL/WTI is more liquid with tighter spreads on most brokers. The spread between WTI and Brent (typically Brent trades $3-$7 higher) widens during US supply gluts or international disruptions.

Let us read the market for you.

OilSniper monitors all supply/demand forces 24/5. We fire the signal — you execute the trade.