Beginner guide

What is
USOIL?

Everything you need to know about trading WTI crude oil — how it works, what moves it, and how to get started with professional signals.

$100B+
Daily volume
100-300
Cent daily range
93%
Signal accuracy
17K+
Traders
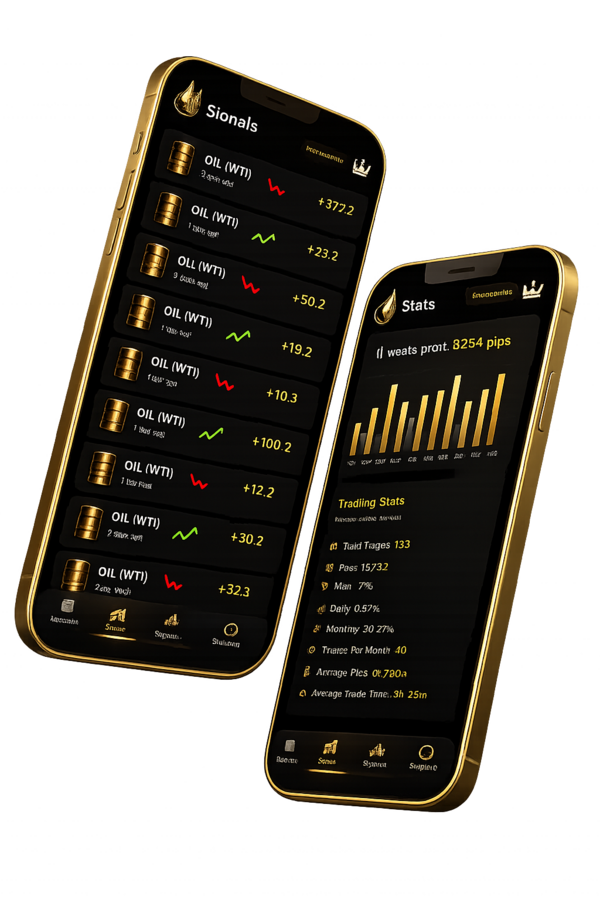
OilTrading app preview
The basics

What is USOIL (WTI Crude)?

USOIL — also known as WTI Crude (West Texas Intermediate) — is the benchmark for US crude oil pricing. It represents light, sweet crude oil delivered at Cushing, Oklahoma, and is the most actively traded physical commodity on earth, with over $100 billion in daily trading volume.

USOIL trades on the CME/NYMEX exchange as physically settled futures contracts, but most retail traders access it as a CFD (Contract for Difference) through forex brokers. When you trade USOIL through a broker, you never take delivery of physical crude — you speculate on price direction, and your profit or loss is settled in cash.

WTI differs from Brent crude (the international benchmark, sourced from the North Sea). WTI is lighter and sweeter — meaning it has lower density and less sulphur — which makes it more efficient for refining into gasoline. Brent typically trades at a $3-$7 premium to WTI due to transportation and geopolitical factors.

Contract specifications

The standard USOIL futures contract on CME/NYMEX represents 1,000 barrels of crude oil. Most forex brokers offer CFDs on a 1:1 basis (1 lot = 1,000 barrels) with mini lots (0.1 = 100 barrels) and micro lots (0.01 = 10 barrels). Here are the key specs:

AttributeStandard (1.0)Micro (0.01)
Contract size1,000 barrels10 barrels
1 cent move =$10.00$0.10
100 cent move =$1,000.00$10.00
Typical margin$500–$1,000$5–$10

How oil is quoted

USOIL is quoted in dollars and cents per barrel. A typical quote looks like: $78.50. The price moves in cents (tick size: 0.01), and each cent on a standard lot is worth $10.00:

Pip (cent) value = Lot size × $10.00
1.00 lot → $10.00/cent  |  0.10 lot → $1.00/cent  |  0.01 lot → $0.10/cent

Trading hours

USOIL trades 23 hours a day, 5 days a week (Monday 00:00 to Friday 23:00 GMT+3) with a 1-hour daily break. This near-24-hour availability means you can trade oil from any timezone, though the US session (9:30 AM – 5:00 PM ET) provides the highest volume and tightest spreads.

Why oil?

Why trade USOIL?

USOIL is one of the most attractive trading instruments for retail traders. Here's why professionals and beginners alike gravitate toward crude oil:

Massive daily ranges

USOIL moves 100-300 cents per day on average, and can spike 500+ cents during major events. That's $100-$300 per standard lot per day in potential range. For comparison, EUR/USD might move 50-80 pips in a day — USOIL offers significantly more trading opportunity. The volatility means both larger profit potential and the need for disciplined risk management.

Clear fundamental drivers

Unlike forex pairs that can move on obscure central bank speeches, oil has transparent, scheduled catalysts. Every Wednesday at 10:30 AM ET, the EIA releases inventory data — the single biggest weekly mover. OPEC+ meets quarterly. Baker Hughes releases rig counts Fridays. You can plan your trading week around these known events rather than constantly monitoring the news.

High leverage, low barrier to entry

Most forex brokers offer USOIL with leverage up to 1:500, and minimum deposits as low as $50-$200. With micro lots (0.01 = 10 barrels), you can control a meaningful position with a small account. A $500 account trading 0.02-0.05 lots keeps risk at 1-2% per trade while participating in oil's daily moves.

Available everywhere

USOIL is offered on every major forex and CFD broker: XM, IC Markets, Pepperstone, Exness, FTMO, Oanda, and dozens more. It trades on MetaTrader 4, MetaTrader 5, cTrader, and TradingView. You're never locked into a specific platform or broker to access the oil market.

Seasonal patterns you can trade

Oil exhibits strong seasonal tendencies. The summer driving season (May-September) increases gasoline demand, while winter heating oil demand (November-February) supports prices during colder months. These recurring patterns give traders an edge that doesn't exist in most forex pairs.

Oil vs gold

USOIL vs XAUUSD comparison.

Many traders move between oil and gold. Understanding the key differences helps you choose the right instrument for your strategy — or trade both with proper context.

Characteristic USOIL (WTI) XAUUSD (Gold)
Instrument type Growth commodity, demand-driven Safe haven, store of value
Exchange CME/NYMEX OTC only (LBMA)
Contract size 1,000 barrels 100 troy ounces
Expiration Monthly (futures rollover ~20th) None (spot, no expiration)
Key report EIA Weekly (Wed 10:30 AM ET) FOMC / CPI / NFP
Daily range 100-300 cents 200-500+ pips
$ value per tick (1 lot) $10.00 per cent $10.00 per pip
Typical spread 3-5 cents 0.3-1.0 pips
Gap risk High (geopolitical weekends, $2-5) Moderate
Seasonality Summer driving, winter heating No strong seasonal pattern
DXY correlation -0.4 to -0.6 -0.7 to -0.9
Institutional demand GDP growth = more demand Central bank reserves (36K+ tonnes)
Market participants

Who trades oil?

The USOIL market's $100+ billion daily volume comes from a diverse ecosystem of participants, each with different objectives and time horizons:

Retail traders — Individual speculators trading oil CFDs through forex brokers. They typically use technical analysis, signals, and economic calendars with timeframes from minutes to days. The rise of mobile apps like OilSniper has made oil accessible to anyone with a smartphone.

Commercial hedgers — The backbone of the oil market. Airlines hedge jet fuel costs. Refineries lock in crude input prices. Oil producers (ExxonMobil, Chevron, Shell) sell forward to guarantee revenue. Shipping companies hedge bunker fuel. These participants aren't speculating — they're managing real-world business risk.

Institutional speculators — Hedge funds and CTAs (Commodity Trading Advisors) run systematic strategies on oil futures. Their positioning is tracked in the CFTC Commitments of Traders (COT) report each Friday. Large speculator net-long positions provide valuable insight into market sentiment.

Governments and sovereign funds — The US Strategic Petroleum Reserve (SPR) holds up to 714 million barrels. SPR releases (like the 180M barrel release in 2022) can flood the market and suppress prices. Sovereign wealth funds from oil-producing nations (Saudi Arabia, UAE, Norway) are major market participants.

Market makers and banks — Goldman Sachs, Morgan Stanley, JPMorgan, and Citi dominate oil derivatives trading and provide liquidity. Their research reports and price forecasts (Goldman's commodity outlooks are particularly influential) can move markets.

Key facts

Oil trading at a glance.

Daily Range 100-300 Cents per day typical. Can spike 500+ during OPEC or geopolitical events.
Contract Size 1,000 bbl Standard lot = 1,000 barrels. Micro = 10 barrels. Traded on CME/NYMEX.
Tick Value (1 lot) $10.00 Every 1 cent move on a standard lot equals $10.00 profit or loss.
Key Report EIA Wed Weekly Petroleum Status, 10:30 AM ET. The #1 weekly price mover.
Exchange CME/NYMEX WTI futures trade on the Chicago Mercantile Exchange. CFDs via brokers.
Max Leverage Up to 1:500 Offshore brokers offer high leverage. EU/UK regulated brokers cap at 1:30.
Getting started

How to start trading oil.

Getting from zero to your first oil trade involves five straightforward steps. The key is preparation — most beginners who lose money skipped the demo phase or used position sizes too large for their account.

Step 1: Choose a regulated broker with tight oil spreads

Select a broker that offers USOIL with competitive spreads (3-5 cents standard, 0-1 cent ECN), reliable execution, and strong regulation. Look for FCA (UK), ASIC (Australia), or CySEC (Cyprus) oversight. IC Markets, Pepperstone, and XM are popular choices with spreads as low as 0.0 cents on ECN accounts.

Step 2: Open a demo account and learn the rhythm

Every reputable broker offers a free demo account. Spend at least 2-4 weeks trading USOIL on demo. Learn how the price moves during different sessions, how spreads widen before EIA reports, and what a 100-cent move feels like on your equity. Demo removes the emotional pressure while you build mechanical skills.

Step 3: Master the oil calendar

Understand the weekly rhythm: API report Tuesday 4:30 PM ET (preview), EIA inventory Wednesday 10:30 AM ET (main event), Baker Hughes rig count Friday 1:00 PM ET. Quarterly OPEC+ meetings. Mark these on your calendar — they're the biggest volatility events every oil trader watches.

Step 4: Start small with real money

Deposit $200-$500 — an amount you can afford to lose. Trade micro lots (0.01 = 10 barrels) where each cent move is worth $0.10. A 100-cent stop-loss on 0.02 lots costs you only $2. This lets you experience real trading psychology without risking your account on a single trade.

Step 5: Follow professional oil signals

Signal services like OilSniper provide exact entry, stop-loss, and take-profit levels — removing the analysis burden while you're still learning. This lets you take real trades with professional guidance while building your own analytical skills. Over time, you combine signals with your own market reads.

Price drivers

What moves the oil price?

Oil prices are driven by a combination of supply dynamics, demand growth, geopolitics, and the US dollar. Unlike gold — which moves primarily on interest rates and safe-haven flows — oil responds to real-world supply and demand imbalances.

EIA Weekly Petroleum Status (Wednesday 10:30 AM ET) — The #1 weekly mover. This report covers crude oil inventories, production levels, refinery utilization, and gasoline/distillate stockpiles. A larger-than-expected crude build is bearish; a draw is bullish. Most professional oil traders plan their entire week around this release.

OPEC+ production decisions — The Organization of Petroleum Exporting Countries plus allies (Russia, led by Saudi Arabia) controls roughly 40% of global oil supply. When OPEC+ announces production cuts, oil rallies $3-$8 per barrel. When they increase quotas, prices fall. Meetings are quarterly but emergency sessions can be called anytime.

Geopolitical events — The Strait of Hormuz (between Iran and Oman) sees 20% of global oil pass through daily. Any disruption — Iran tensions, Houthi attacks on shipping, regional conflict — sends oil spiking. Russia-Ukraine sanctions, Libya civil unrest, and Venezuela production outages all move prices. Weekend gap risk is significant in oil.

The US Dollar (DXY) — Oil is priced globally in USD. When the dollar strengthens, oil becomes more expensive for non-dollar buyers, reducing demand. The DXY-oil correlation is approximately -0.4 to -0.6. Major dollar events (Fed decisions, NFP) create notable oil moves.

Global economic growth — Oil is the ultimate growth commodity. When GDP expands, factories run, trucks deliver, planes fly — oil demand rises. Chinese PMI data (the world's largest oil importer), US GDP, and global manufacturing indices all impact oil. Recession fears are bearish; growth surprises are bullish.

Seasonal demand patterns — Summer driving season (Memorial Day to Labor Day) boosts gasoline demand. Winter heating oil demand supports prices November-February. Refinery maintenance seasons (spring and autumn) temporarily reduce crude demand. These predictable patterns create recurring trade setups.

Market hours

Oil trading sessions.

USOIL trades 23 hours a day, Monday through Friday, with a 1-hour daily break. Volume and volatility vary significantly across sessions — knowing which hours to trade is critical.

Asian Session

7 PM – 4 AM EST

Lower volume. Ranges of 30-80 cents typical. Chinese economic data (PMI, trade balances) can cause spikes. Best for range-trading and position accumulation.

Best for: Range trading

European Session

3 AM – 12 PM EST

Volume picks up as London opens. IEA and OPEC reports often released during this window. Brent/WTI spread trades active.

Best for: Trend following

US Session

9:30 AM – 5 PM EST

Highest volume. EIA report drops Wed at 10:30 AM ET. API preview Tue at 4:30 PM ET. Baker Hughes rig count Fri at 1 PM ET. Most institutional flow.

Best for: All strategies

EIA Release Window

Wed 10:00 AM – 12 PM EST

The weekly highlight. Inventory numbers drop at 10:30 AM. Expect 50-150 cent swings in the first 5 minutes. Spreads widen temporarily. Many pros trade only the post-EIA trend 30 min after release.

Best for: News trading
App demo

See USOIL trading in action.

Watch beginners place their first oil trade using OilSniper signals.

Download the App →
FAQ

Frequently asked questions.

What is USOIL (WTI Crude)?

USOIL represents West Texas Intermediate (WTI) crude oil — the US benchmark for crude pricing and the most liquid commodity on earth. It trades on the CME/NYMEX exchange as physically settled futures contracts with a standard size of 1,000 barrels. Most retail traders access USOIL as a CFD through forex brokers, speculating on price direction without taking physical delivery. WTI is lighter and sweeter (lower sulphur) than Brent crude, making it more efficient for gasoline refining. The delivery point is Cushing, Oklahoma — a major pipeline and storage hub.

What is the best time to trade USOIL?

The best time is the US trading session (9:30 AM to 5:00 PM ET). Wednesday mornings are especially critical due to the EIA Weekly Petroleum Status Report at 10:30 AM ET — the single biggest weekly price mover. On Tuesdays, the API report at 4:30 PM ET provides a preview of EIA data. Fridays feature the Baker Hughes rig count at 1:00 PM ET. The US session provides maximum liquidity, tightest spreads (3-5 cents), and the 100-300 cent daily ranges that make oil so tradable.

How much does it cost to trade 1 lot of USOIL?

A standard lot of USOIL is 1,000 barrels. Margin requirements range from $500 to $1,000 per lot depending on your broker and leverage. Each 1 cent (0.01) movement equals $10.00 on a standard lot, $1.00 on a mini lot (0.10 = 100 barrels), and $0.10 on a micro lot (0.01 = 10 barrels). Beginners should start with micro lots — a $500 account trading 0.02-0.05 lots keeps risk at 1-2% per trade while still capturing meaningful moves.

What moves USOIL prices the most?

The five biggest drivers are: (1) EIA Weekly Petroleum Status Report every Wednesday at 10:30 AM ET — the #1 weekly catalyst; (2) OPEC+ production quota decisions, which can move oil $3-$8 per barrel; (3) Geopolitical events, especially in the Middle East (Strait of Hormuz) and Russia-related sanctions; (4) USD strength (DXY), since oil is priced in dollars — a stronger dollar typically pressures oil lower; and (5) Global GDP growth and Chinese demand data, as oil demand is directly tied to economic activity. The API report on Tuesday at 4:30 PM ET provides an early preview of EIA data.

Start trading oil smarter.

Professional USOIL signals with exact entry, SL, and TP levels. Free to download.