 OILTRADING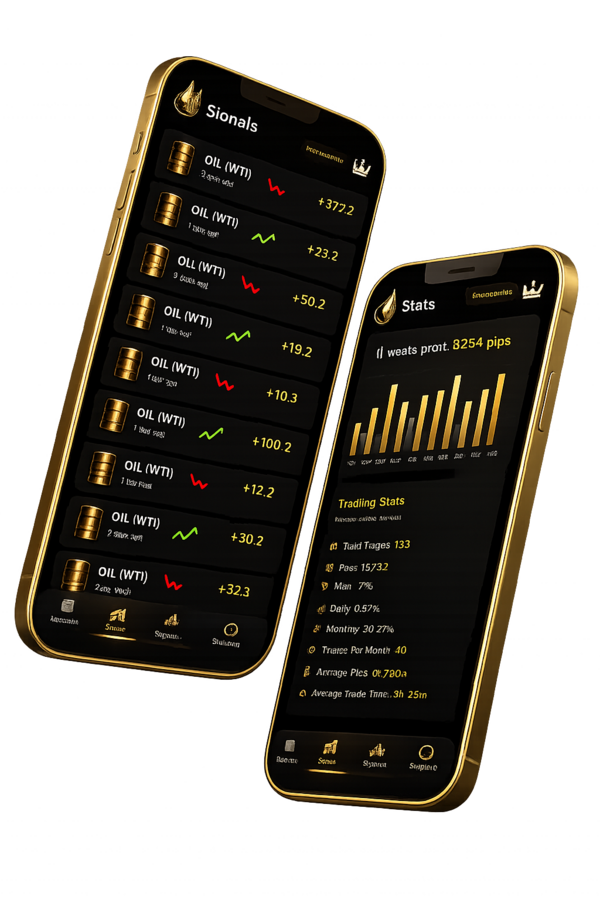
Why oil is ideal for multiple strategies.
Most financial instruments favor one style of trading. Forex majors like EUR/USD tend toward range-bound behavior, rewarding mean-reversion strategies. Individual stocks trend well but have limited trading hours and wide overnight gaps. Oil, uniquely, accommodates almost every approach:
Strong trends. Oil frequently enters multi-week directional trends driven by supply-demand fundamentals (OPEC+ production decisions, inventory builds/draws, geopolitical disruptions). The 2024 oil rally from $68 to $85+ was a sustained trend driven by OPEC+ production cuts and geopolitical risk that rewarded patient trend followers for months.
High intraday volatility. With 100–300 cent daily ranges, oil provides ample movement for scalpers and day traders to capture within a single session. A one-cent move on a standard lot (1,000 barrels) equals $10 — so a 200-cent day offers $2,000 of potential movement per lot.
Predictable catalysts. Oil's price drivers are well-known and scheduled: EIA Weekly Petroleum Status (Wed 10:30 AM ET — the #1 weekly mover), OPEC+ meetings (quarterly), Baker Hughes Rig Count (Fri 1:00 PM ET), and API inventory preview (Tue 4:30 PM ET). News traders can prepare in advance for these high-probability volatility events.
Deep liquidity. Over $100 billion in daily volume makes USOIL the most liquid commodity on earth. Minimal slippage for retail orders and tight 3-5 cent spreads during active sessions. You can enter and exit positions at or near your intended price, which is critical for scalping and tight stop-loss strategies.
Clear technical levels. Oil respects psychological round-number levels ($60, $70, $80, $90, $100), historical support/resistance zones, and moving averages more consistently than many instruments. These clear levels make chart-based strategies highly reliable.
Proven USOIL strategies.
Each strategy has distinct characteristics suited to different trader profiles. Review all six, then choose one to master before adding others.
EIA Inventory Trade
Trade the volatility around the weekly EIA Petroleum Status Report. Fade the initial spike or trade the post-report trend after 30 minutes of price discovery.
OPEC+ Meeting Trade
Position ahead of OPEC+ quota decisions. Production changes can move oil $3-$8 per barrel. Wider stops essential due to headline-driven volatility.
Crack Spread Analysis
Trade the spread between crude oil and refined products (gasoline, diesel). Widening spreads signal strong refinery demand and support crude prices.
Seasonal Patterns
Capture predictable seasonal demand shifts: summer driving season (buy Apr-May) and winter heating oil demand (buy Sep-Oct). Multi-week position trades.
Correlation Trade
Trade oil alongside CAD (Canada is a major exporter) or RUB. When oil rallies, CAD strengthens. Cross-asset confirmation improves entry timing.
Signal-Based Trading
Follow professional trade signals with exact entry, SL, and TP levels. Removes analysis burden. Ideal for beginners and those who can't watch charts all day.
Strategy breakdowns.
1. EIA Inventory Trade
The EIA Weekly Petroleum Status Report — released every Wednesday at 10:30 AM ET — is the single biggest weekly catalyst for USOIL. The report details US crude inventories, production levels, refinery utilization, and gasoline/distillate stocks. A larger-than-expected crude build typically pressures oil lower; a draw supports prices. The initial reaction can move oil 50-150 cents in the first 5 minutes.
How it works on oil: The API releases its own inventory estimate on Tuesday at 4:30 PM ET, which serves as a preview. Compare the API number with analyst consensus for the EIA. If API shows a surprise (large draw when a build was expected), position in that direction before Wednesday's release. The EIA report itself creates two trading opportunities: (1) the initial spike, usually fading within 15-30 minutes, and (2) the post-report trend that establishes 30-60 minutes after release.
Approach 1 — Fade the spike: Wait for the initial 5-minute reaction candle after 10:30 AM. If the spike is sharp (40+ cents), enter a fade trade in the opposite direction with a stop 15-20 cents beyond the spike extreme. Target 50% retracement of the spike. This works because initial reactions often overshoot as algorithms react faster than humans can process the data.
Approach 2 — Trade the trend: Wait 30 minutes after the release. By this point, the market has absorbed the data and a directional bias emerges. Enter in the direction of the 30-minute trend with a stop 20-30 cents below the post-release low (for longs) or above the post-release high (for shorts). Target the pre-release range extension.
Key levels to watch: Crude inventory change vs. consensus (typically ±2-3 million barrels). Cushing storage levels (delivery hub for WTI). Gasoline inventories (demand proxy). Refinery utilization rates (demand for crude input). A surprise across multiple metrics amplifies the move.
2. OPEC+ Meeting Trade
OPEC+ (OPEC plus Russia and other allied producers) meets quarterly to set production quotas that directly control roughly 40% of global oil supply. Quota changes — whether production cuts or increases — can move oil $3-$8 per barrel (300-800 cents) within hours. These meetings are the highest-impact scheduled events in oil trading.
How it works on oil: In the days leading up to an OPEC+ meeting, oil prices often price in the expected outcome based on leaked comments from delegates and energy journalists. The actual decision — and any surprises on quota allocations — drives the post-meeting move. The communiqué is typically released during the meeting, not at a fixed time, so the release itself can come at any moment.
Pre-meeting strategy: If consensus expects a production cut (bullish), oil will likely rally into the meeting. Consider taking a long position 2-3 days before with a stop below the pre-rally consolidation level. Reduce position size by 50% before the meeting or close entirely — the decision itself is binary risk.
Post-meeting strategy: Wait for the communiqué. If the decision is a surprise cut (more than expected), buy the breakout with a 100-150 cent stop. If the decision disappoints (no cut or smaller cut than expected), the sell-off can be aggressive — wait for the first 30-minute candle to set the range, then trade the direction of the break. Targets: $3-$5 per barrel for significant quota changes.
Critical rule: Position sizing must be conservative for OPEC+ trades. The gap risk between the decision leaking and the communiqué being published can create 200+ cent slippage. Never risk more than 0.5% of your account on pre-meeting positions.
3. Crack Spread Analysis
The crack spread is the difference between the price of crude oil and the price of refined products (gasoline and diesel/heating oil). It's called the "crack" spread because it represents the profit margin from "cracking" crude oil into its refined components. Professional oil traders watch crack spreads closely because they signal refinery demand for crude.
How it works: When the crack spread widens (refined products rising faster than crude), refineries have a strong incentive to buy more crude oil to process — this extra demand supports crude prices. When the crack spread narrows (product prices falling relative to crude), refineries cut back on crude purchases, pressuring crude prices lower.
Key crack spreads to track: (1) Gasoline crack spread (RBOB gasoline futures minus WTI crude) — most relevant during summer driving season. (2) Heating oil/diesel crack spread (ULSD minus WTI) — most relevant during winter. (3) 3-2-1 crack spread — a composite of 3 barrels crude to 2 barrels gasoline + 1 barrel distillate. Widely quoted as the refining margin benchmark.
Trading approach: When the 3-2-1 crack spread reaches extreme levels (unusually wide or narrow), expect mean reversion. A widening crack spread over 2-3 weeks supports crude longs. A narrowing spread signals crude weakness. Use the crack spread as a confirming indicator alongside technical levels — don't trade it in isolation.
4. Seasonal Patterns
Oil exhibits strong seasonal patterns driven by predictable demand cycles. Unlike most financial instruments where seasonality is weak, oil's physical consumption follows reliable annual rhythms that create tradable price trends.
Summer driving season (May-September): US gasoline demand peaks during summer months as vacation travel increases. Refineries ramp up crude purchases in April-May to build gasoline inventories ahead of the driving season. This pre-season buying typically supports oil prices. Strategy: look for long entries in April-May, targeting the June-July peak. Historical data shows oil prices rise during this period in roughly 65% of years.
Winter heating oil demand (November-February): Heating oil and diesel demand rises as temperatures drop in the Northern Hemisphere. Refineries shift production toward distillates, supporting crude demand. Strategy: look for long entries in September-October, before the winter demand materializes. Cold weather surprises (polar vortex events) can create sharp, short-term spikes of $3-$5/barrel.
Shoulder seasons (March-April, October-November): These transition periods between seasonal demand peaks often see price weakness as refineries undergo maintenance (turnarounds), temporarily reducing crude demand. These can be good opportunities to buy dips for the next seasonal rally.
Hurricane season risk (June-November): Gulf of Mexico hurricanes can disrupt US offshore oil production (~15% of US output) and Gulf Coast refinery operations. Supply disruptions are bullish for crude; refinery disruptions are bearish (less demand for crude). The net effect depends on which infrastructure is affected.
5. Correlation Trade
Oil has strong, tradable correlations with certain currencies and assets. Understanding these relationships provides confirmation for oil trades and can create cross-asset opportunities.
Oil vs. CAD (Canadian Dollar): Canada is the world's 4th largest oil producer and a major exporter to the US. When oil prices rise, the Canadian economy benefits, and CAD strengthens against USD. The USDCAD pair (inverted) has a -0.6 to -0.8 correlation with USOIL. Strategy: when you're bullish on oil, look for long USDCAD shorts (long CAD) as a confirming trade. When oil and CAD diverge significantly, one is likely to catch up — creating a mean-reversion opportunity.
Oil vs. RUB (Russian Ruble): Russia's economy and government budget are heavily dependent on oil revenues (roughly 30-40% of budget). When oil prices fall, the ruble weakens. This correlation is less reliable than CAD due to capital controls and sanctions risk, but during normal market conditions it provides an additional data point.
Oil vs. DXY (US Dollar Index): Oil is priced globally in US dollars. A stronger dollar makes oil more expensive for non-USD buyers, reducing demand. The DXY has a -0.4 to -0.6 correlation with oil. Use dollar weakness as a tailwind for oil longs and dollar strength as a headwind. This is the petrodollar effect — one of the most enduring relationships in global markets.
Trading approach: Use correlations as a confirmation filter, not a standalone strategy. If your technical analysis says buy oil, check that CAD is strengthening (USDCAD falling) and DXY is not surging. When all three align, the probability of a successful trade increases significantly.
6. Signal-Based Trading
Signal-based trading is the most accessible strategy for two reasons: it requires no technical or fundamental analysis skill, and it provides exact execution levels. A professional analyst does the work; you execute the trade. This approach is particularly effective for beginners, part-time traders, and anyone who wants exposure to oil without dedicating hours to chart analysis.
How it works: You subscribe to a signal provider (like OilSniper) and receive trade alerts with exact entry price, stop-loss, and take-profit levels. When a signal fires, you open your broker platform, navigate to USOIL, and place the order with the provided levels. Total execution time: 15–30 seconds per trade.
Why it works: Professional signal providers combine technical analysis, fundamental context (EIA data, OPEC+ developments, seasonal factors), and pattern recognition to identify high-probability setups. OilSniper's 93% accuracy rate means the vast majority of trades reach their take-profit target. Each signal includes risk management by default — you're never left guessing about stop-loss placement.
What you still need to do: Calculate your lot size based on the signal's stop-loss distance and your account's 1% risk. Remember that 1 cent = $10 per standard lot on USOIL. Execute the trade promptly when the signal fires — delayed entries reduce accuracy. Follow the signal exactly as given — don't modify the SL or TP levels.
Best for: Beginners who are still learning. Full-time workers who can't monitor charts. Experienced traders who want a secondary income stream with minimal time investment. Prop firm traders who need consistent results to maintain funded status.
Best strategy for beginners.
If you're new to oil trading, start with signal-based trading. Here's the reasoning:
Oil is a fundamentally-driven commodity with complex supply-demand dynamics — OPEC+ politics, EIA inventory data, crack spreads, seasonal patterns, and geopolitical risk all influence price simultaneously. Learning all of this takes months. While you're building that knowledge, a signal-based approach lets you participate in the market with proven trade setups, learn from real trades, and build your account (or at least protect it from the beginner mistakes that destroy most new accounts).
Think of it as training wheels for oil trading. Each signal you execute is a lesson in how professional oil traders think:
- You learn where experienced traders place entries (at key levels like $70, $80, $90 — not random spots)
- You learn where they put stop-losses (at structural invalidation points, accounting for oil's 5-cent spreads)
- You learn where they target profits (at logical resistance/support, with favorable R:R)
- You build muscle memory for position sizing — 1 cent = $10 per lot
- You experience real market psychology — handling wins and losses with real money during EIA spikes
After 2–3 months of signal-based trading, you'll have enough market experience to begin learning the fundamentals — EIA reports, OPEC+ dynamics, seasonal patterns — and developing your own edge. Many traders continue using signals as one component of their approach even after becoming experienced — the two aren't mutually exclusive.
Strategy comparison table.
| Strategy | Screen Time | Trades/Week | Skill Level | Stress Level |
|---|---|---|---|---|
| EIA Inventory | Wed 10-11:30 AM | 1–3 | Intermediate | High |
| OPEC+ Meeting | Quarterly, 2-4 hrs | 1–2 | Advanced | Very High |
| Crack Spread | 15-30 min/day | 1–3 | Advanced | Low-Medium |
| Seasonal Patterns | 15 min/day | 1–2 | Intermediate | Low |
| Correlation Trade | 30-60 min/day | 3–8 | Intermediate | Medium |
| Signal-Based | 5–15 min/day | 5–15 | Beginner | Low |
Strategies in action.
Watch professional oil trading strategies executed with OilSniper signals.
Frequently asked questions.
What is the best strategy for trading oil?
There's no universally "best" strategy. For beginners, signal-based trading is most effective because it removes the analysis burden. The EIA inventory trade (Wednesday 10:30 AM ET) is the most popular weekly strategy among active traders because it offers a scheduled, high-probability volatility event. For experienced traders with time to watch charts, trend following on H1-H4 timeframes offers the best balance of risk-to-reward and win rate.
Can you scalp oil?
Absolutely. Oil is excellent for scalping due to its deep liquidity, 100-300 cent daily ranges, and tight 3-5 cent spreads on ECN accounts. The US session (9:30 AM - 11:30 AM ET) — especially the EIA release window on Wednesdays — provides the best scalping conditions. Target 10-30 cent moves with 5-15 cent stops. You need an ECN broker (IC Markets, Pepperstone) with fast execution. Oil scalping is more forgiving than forex scalping because a 1-cent move = $10, so even small moves pay meaningfully.
What timeframe should I use for oil?
The H1 (1-hour) chart is the most versatile for oil trading — detailed enough for precise entries but smooth enough to filter noise. Use H4 or Daily for trend direction and M15 for entry timing. For the EIA inventory trade, use M15-M30 around the release. For seasonal pattern analysis, use the Daily and Weekly charts. Multi-timeframe analysis (analyze on H4, decide on H1, enter on M15) is the professional standard.
How many cents does oil move per day?
Oil typically moves 100-300 cents per day ($1.00-$3.00 per barrel), measured from daily low to daily high. On high-impact days (EIA report Wednesdays, OPEC+ meetings), ranges can exceed 500 cents. During quiet periods (Asian session, post-holiday), ranges may contract to 40-80 cents. At $10 per cent per standard lot, a 200-cent day represents $2,000 in potential price movement per lot — significantly more dollar movement than most forex pairs.
Explore more resources.
What is USOIL?
Complete beginner's guide to oil trading basics.
Read more →Risk Management
Protect your capital: position sizing, SL, and oil-specific risks.
Read more →Best Brokers
Compare top brokers for executing your oil strategy.
Read more →Oil Trading Glossary
A–Z dictionary of oil trading terminology.
Read more →Oil Signals
Professional signal-based trading — 93% accuracy.
Read more →Live Oil Price
Real-time USOIL chart with support and resistance.
Read more →Execute strategies with precision.
Professional oil signals with exact entry, SL, and TP levels. Free to download.